← All essays·July 20, 2026·11 min read
Your grocery store was running Google's business model before Google existed
Paid placement on a trusted index, an auction for position, and a data business behind the free product: the supermarket had all of it decades before paid search. Retail media did not turn the grocer into an ad platform. It turned the shelf's oldest business model digital, and finally disclosed it.
Listen to this page
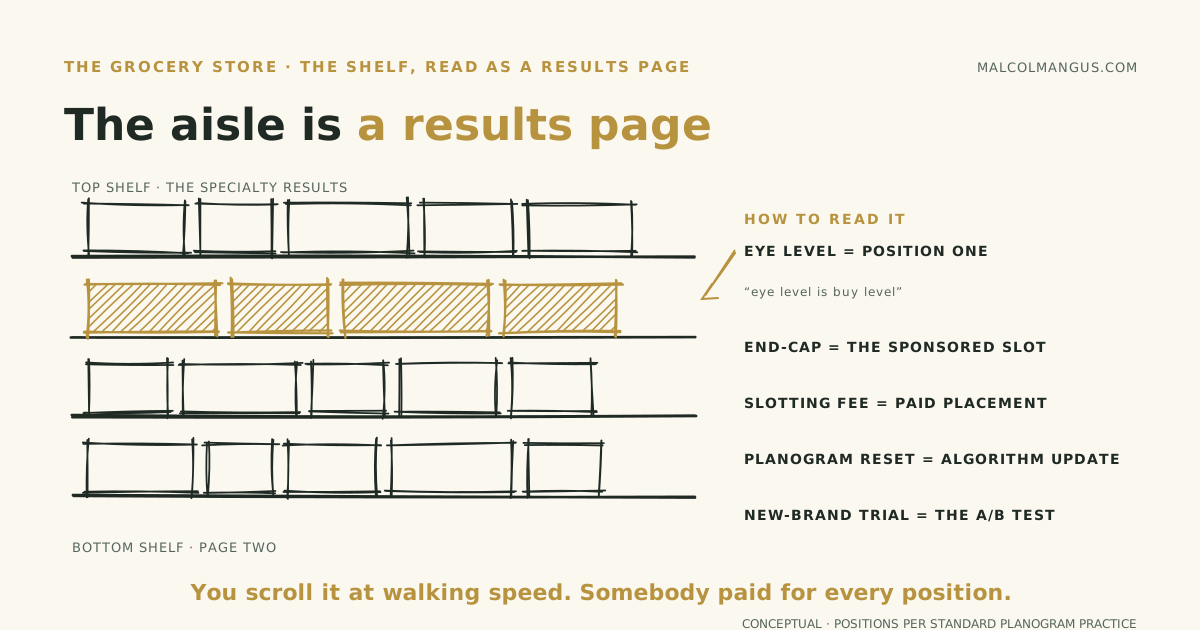
In 1994, researchers ran a field experiment across 60 Chicago supermarkets and measured what a shelf position is worth. Moving a product from its worst position to its best lifted sales 59% on average. The best position sat 51 to 53 inches off the floor, where a resting human gaze lands. And extra facings barely mattered: past a small threshold, more shelf space bought almost nothing, while better position bought everything. Rank matters; redundant impressions don't. Anyone who has managed a search campaign just felt a chill of recognition.
Here is the part the recognition misses: the supermarket was already charging for those positions. Slotting fees, the payments brands make for shelf placement, were standard practice by the 1980s, and when the FTC studied them in 2003 it found $2,313 to $21,768 per item, per retailer, per metro area, with a national launch running $1.5 to 2 million. Google was founded in 1998 and started selling ads in 2000. The grocer had paid placement on a trusted index, position-value curves, and an experimentation program decades earlier. Retail media, the industry's shiny new ad business, did not bolt Google's model onto a store. The store was running the model first, on paper, at walking speed. What changed is that the rate card became an auction, and the money finally showed up on a disclosed line.
One shelf, every shopper
Start with what makes the supermarket's version of the problem harder than Google's. A results page re-ranks for every query; the aisle is a single ranking that must serve every shopper in the trade area at once. The stock-up family, tonight's dinner, the gluten-free household, the price-first pensioner, the premium weekend splurge, the brand switcher: every one of them walks the same fixed index, and every one wants a different number one.
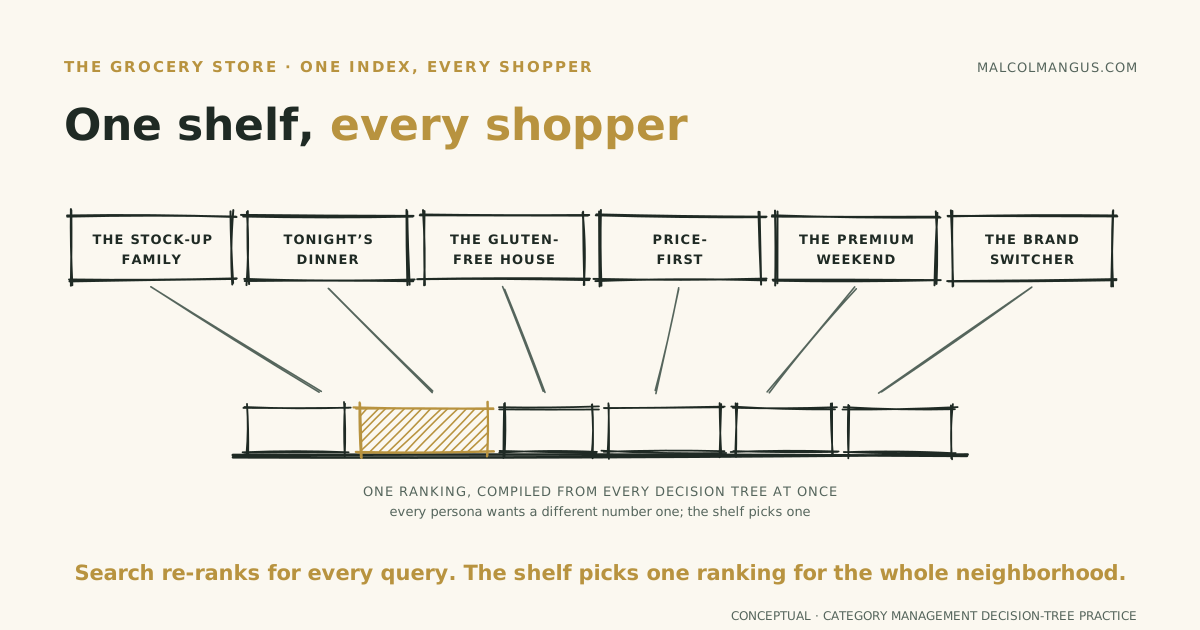
The industry built a whole discipline for this compromise: category management. Retailer and lead brands assign each category a role, build shopper decision trees (does this shopper decide by brand first, or size, or price, or flavor?), and compile the answer into a planogram, the diagram dictating exactly which product sits where, at what height, with how many facings. The decision tree is a query model. The planogram is its compiled output, shipped to physical space, and reset one to four times a year like an algorithm update. A SKU, seen from this angle, is a persona hypothesis, and deleting one is kicking a persona out of the index. The one corner of the store deliberately exempted from all this optimization, the hand-cut cheese counter, breaks even on purpose and earns its floor space through the basket it anchors; I traced that receipt separately.
Put simply: The store serves every customer segment from one fixed layout, so the shelf is a negotiated compromise across every persona in the neighborhood, recompiled a few times a year. Whoever influences that compromise controls market share, which is why influence over it has always been for sale.
Paid placement, paper edition
The money behind the shelf has a polite name, trade spend (retailers call their side of it back margin), and a startling size. The Promotion Optimization Institute puts it at 11 to 27% of CPG manufacturers' revenue, typically the second-largest line on the P&L after cost of goods. Strategy& estimates over $200 billion a year in the US alone, about 20% of gross sales. Nielsen sized the global flow at about $1 trillion a year, and found two-thirds of promotions do not break even; McKinsey, citing later Nielsen work, puts it at 59% of trade promotions losing money globally and 72% in the US. The brands keep paying anyway, because the alternative is someone else's product at 51 inches.
Almost none of this is visible from outside. Grocers book vendor allowances as a reduction of cost of goods sold, which means the shelf's ad revenue flows invisibly into gross margin; the 10-Ks state the policy and disclose no totals. When the GAO tried to study slotting in 2000, trade associations could not find a single member willing to meet; a senator called it retailing's dirty little secret, and a 1999 Senate hearing took testimony from suppliers in hoods with altered voices. You can measure the money's materiality by what happens when it is abused: US Foodservice executives fabricated $700 million of promotional allowances, per SEC enforcement filings in 2004, inflating its parent's operating income by half, and Tesco overstated profits by 263 million pounds by pulling forward supplier income. And the sharpest documented abuse is about the index itself: United States Tobacco, serving as retailers' category captain, trashed competitors' racks and fed retailers skewed category data, and the resulting judgment, affirmed on appeal at $1.05 billion in Conwood v. United States Tobacco, was the largest affirmed antitrust award at the time. Editing the ranking was worth a billion dollars.
Put simply: Brands pay grocers hundreds of billions a year for position and promotion, most of it invisible because accounting folds it into the cost of goods. The shelf has been sponsored for forty years; the sponsorship just never appeared on a line you could read.
The optimization engine underneath
The targeting side of the model arrived on schedule too. Planograms date to the paper era (industry lore credits Kmart in the early 1970s). By 1994, a working grocery chain was hosting 60-store randomized experiments; the same study found that customized shelf layouts beat generic ones and that alphabetizing the soup aisle cut sales 6%, because making search too easy kills browsing. Grocers were running store-panel A/B tests three decades before anyone had a growth team.
Then came the data layer. In 1994, Tesco ran a loyalty-card trial in a handful of stores and handed the analysis to a small consultancy called dunnhumby. At the board presentation, the chairman's verdict became famous: you know more about my customers after three months than I know after 30 years. Clubcard launched nationally in February 1995, and within about a month Tesco had overtaken Sainsbury's as Britain's biggest grocer. The loop closed in America at Kroger, whose loyalty card sits under more than 95% of transactions, per its own annual filing, feeding personalized offers with household coupon-redemption rates north of 70%, against an industry baseline for untargeted coupons of under 2%. Kroger's filing states the thesis outright: the traffic and data generated by the retail business are what enable everything else.
Put simply: The shelf has been instrumented for decades: position experiments since the nineties, loyalty data since 1995, and near-total transaction coverage today. The grocer did not need to learn data-driven ranking from the internet; it taught an early version of the class.
The gold rush: pricing what was always sold
Retail media is the moment all of this became a disclosed, digital, auction-priced business. The numbers are moving fast: US retail media spend was $58.8 billion in 2025, heading for $69.3 billion in 2026, and worldwide it has passed linear television. Walmart's ad business reached about $6.4 billion, growing 46%. Kroger's alternative-profit businesses, led by its media arm, delivered $1.5 billion of operating profit in fiscal 2025.
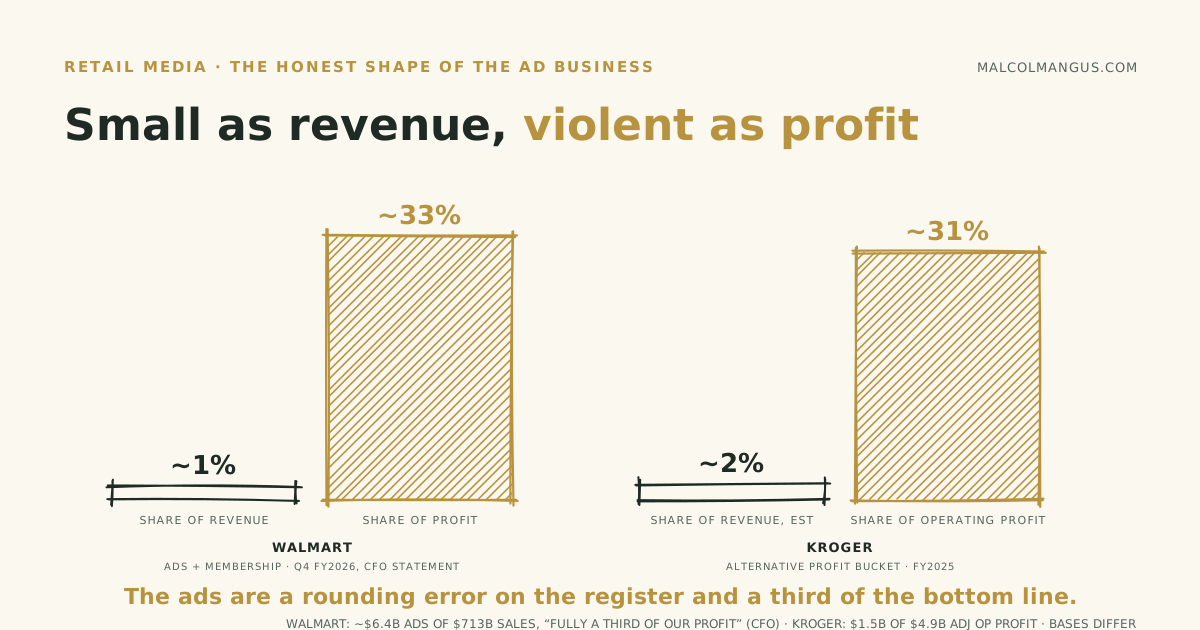
The honest shape of this business is the interesting part. As revenue it is a rounding error: Walmart's $6.4 billion is about 1% of its $713 billion in sales. As profit it is violent: Walmart's CFO says advertising and membership were "fully a third of our profit in the most recent quarter," and Kroger's alternative-profit bucket is roughly 31% of its adjusted operating profit. The mechanism is arithmetic: BCG pegs onsite retail media margins at 70 to 90% sitting on top of a retail business that nets 2%. Instacart is the pure-play proof: its ads line is just over a billion dollars, about 28% of revenue, and roughly the size of its entire adjusted profitability.
And where does the ad money come from? Partly from the old shelf money. BCG's own analysis projects that 30 to 40% of retail media revenue is cannibalized existing trade spending, and frames the ad networks as a defensive strategy for holding onto trade dollars. That is the quiet confession in the consultant deck: this is not a new business so much as the old one, repriced. Google runs auctions priced per click; the grocer ran rate cards priced per slot; retail media is the moment the rate card became an auction. Even the data-licensing detour proves the point. Tesco tried to sell dunnhumby in 2015 hoping for two billion pounds and watched bids sink toward 700 million, because the data's value could not be separated from the retailer. The industry learned the lesson: don't sell the data, sell the ads the data powers.
Put simply: Retail media looks small on the revenue line and enormous on the profit line, because 70-plus-percent-margin ads sit on a 2%-margin store. A third or more of it is the old trade money changing channels; the genuinely new part is measurement, disclosure, and an auction where a rate card used to be.
The rest of the quiet machine
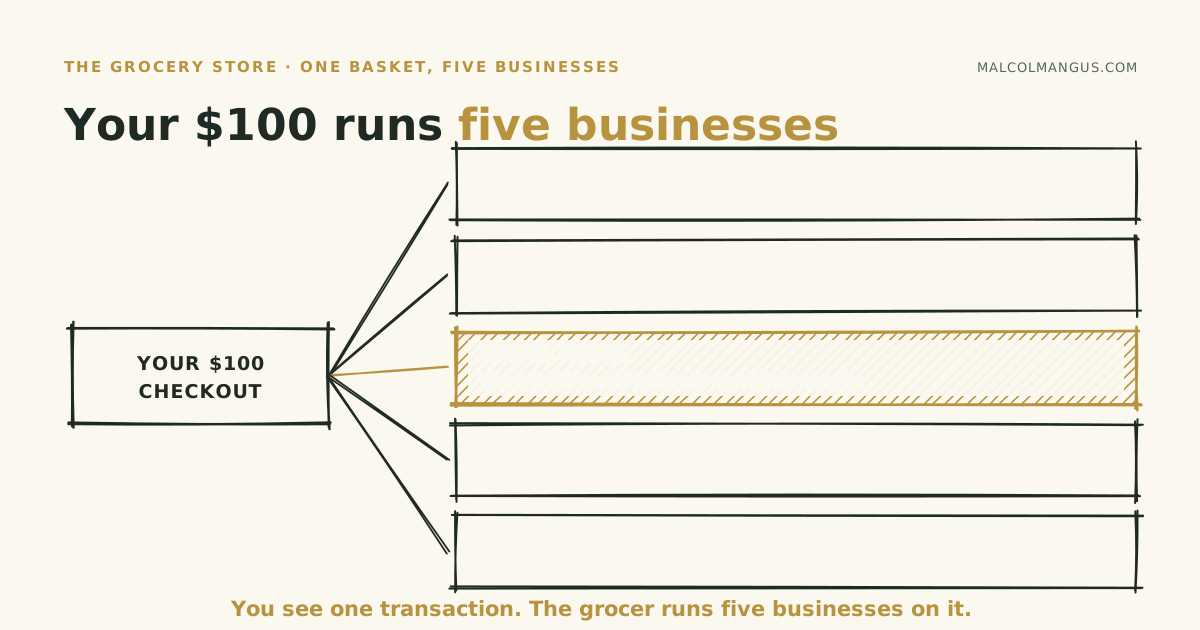
The ad business is the headline, but the store runs several engines the register never itemizes, and one map holds them:
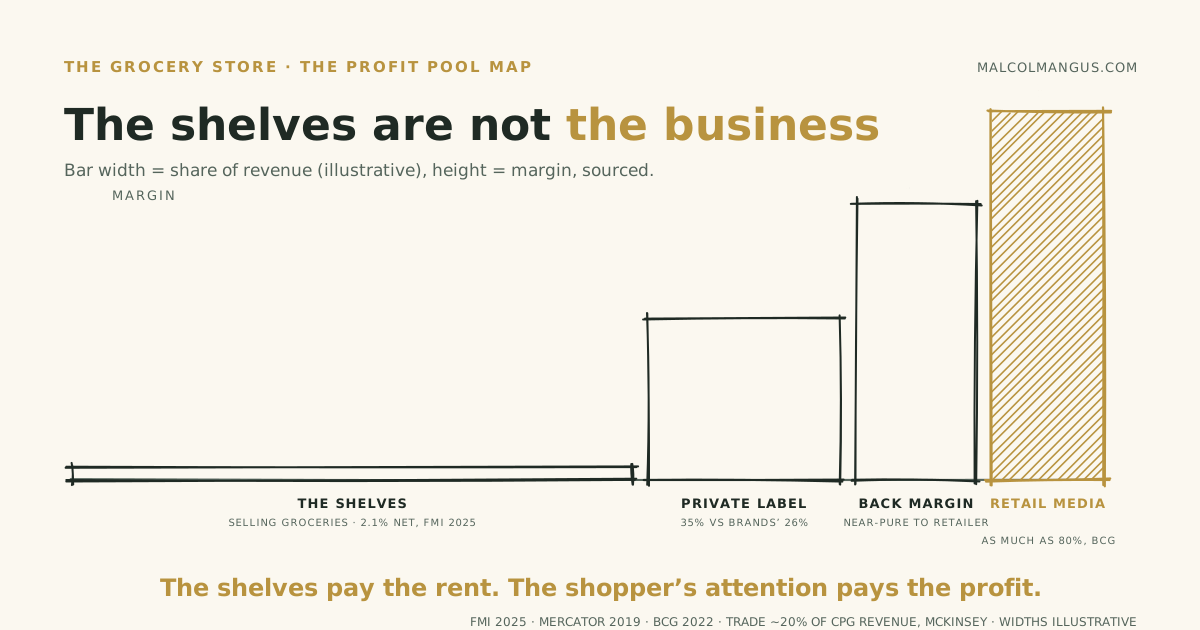
Private label is the biggest clean-margin engine of the group: store brands hit a record $282.8 billion and 23.5% unit share in 2025, carrying margins of about 35% versus 26% for national brands, per Mercator. Costco's Kirkland Signature alone is about $86 billion, roughly a third of the company's revenue, per reporting on its fiscal 2024. The private label is also a bargaining chip in the ad business: the retailer selling you placement also owns your best-positioned competitor.
Pharmacy and fuel read like revenue lines (each about 10% of Kroger's sales) but function as traffic and data annuities: prescriptions and fill-ups are the habit loops that keep the loyalty graph dense, even as pharmacy margins get squeezed hard. The gift card rack deserves one sentence of honesty: it is a small slice, a five-or-six-percent commission on other companies' currency, worth mentioning mostly because Safeway quietly built its rack operator, Blackhawk Network, into a company that sold to private equity for $3.5 billion, which tells you what even the register's side hustles can become.
All of it rests on the famous baseline: food retail net margins were 2.1% in 2025, per FMI, with about one in nine retailers losing money. The gap between a 23-to-27% gross margin and a 2% net is where every other engine lives, invisibly, exactly the way vendor allowances are booked.
Put simply: Groceries are the 2%-margin front of a building full of better businesses: the brands' shelf payments, the store's own labels, the ads, the data. When a business looks impossibly thin and thrives anyway, look for the lines the register doesn't print.
The index was always for sale
So the title is not a metaphor stretched over a supermarket; it is a genealogy. A trusted free index that people consult by habit. Organic results ranked by an optimization engine. Sponsored positions sold to the highest payer, at prices the position data justifies to the inch. An experimentation culture measuring every change. A data asset so good its owner's chairman found it frightening, monetized not by selling the data but by selling access to the audience it describes. That was the supermarket by 1995. Google shipped the same architecture for the web and got credit for inventing the century's best business model; the grocer had simply been running it in a building, without disclosing the ad revenue.
I mapped where whole industries' profits settle elsewhere, and this essay is that map drawn inside one store. The pattern repeats at every altitude: the activity everyone sees, selling groceries at two cents on the dollar, is the front; the profit pools behind it belong to whoever owns the index, prices the positions, and reads the data. The private mint essay found companies quietly running central banks; the supermarket has been quietly running a search engine. Next time you reach for the eye-level jar, notice what you just clicked.
Put simply: The grocery store is a trusted index with sponsored slots, an optimizer, and a proprietary behavior dataset, and it monetizes exactly the way search does: thin front business, violent ad margins behind it. The model wasn't adopted from Google. It was here first, un-itemized, at eye level.

Malcolm Angus
I'm an analytics engineer, data product manager, and forward-deployed engineer. I write about data products, moats, flywheels, and business strategy, the loops that make companies harder to catch.

The charts in this essay are free to reuse with credit.